

INSAR:
WHAT IS IT AND WHAT IS IT FOR?
InSAR stands for Interferometric Synthetic Aperture Radar. SkyGeo does the interferometry, the “In” in InSAR. We get SATR images from a variety of suppliers.
Satellites have been acquiring radar images of the earth’s surface for decades. These images we combine to enable geodetic estimation of slow displacement patterns on the ground.
We do complex “interferometric” math using large sets of complex radar data, to create understandable information about how the surface is moving.
InSAR done right is a proven technique for estimating relative ground movements using radar images.
WHAT IT IS NOT
InSAR is not imaging but a set of very complex math operations with 100s of control points.
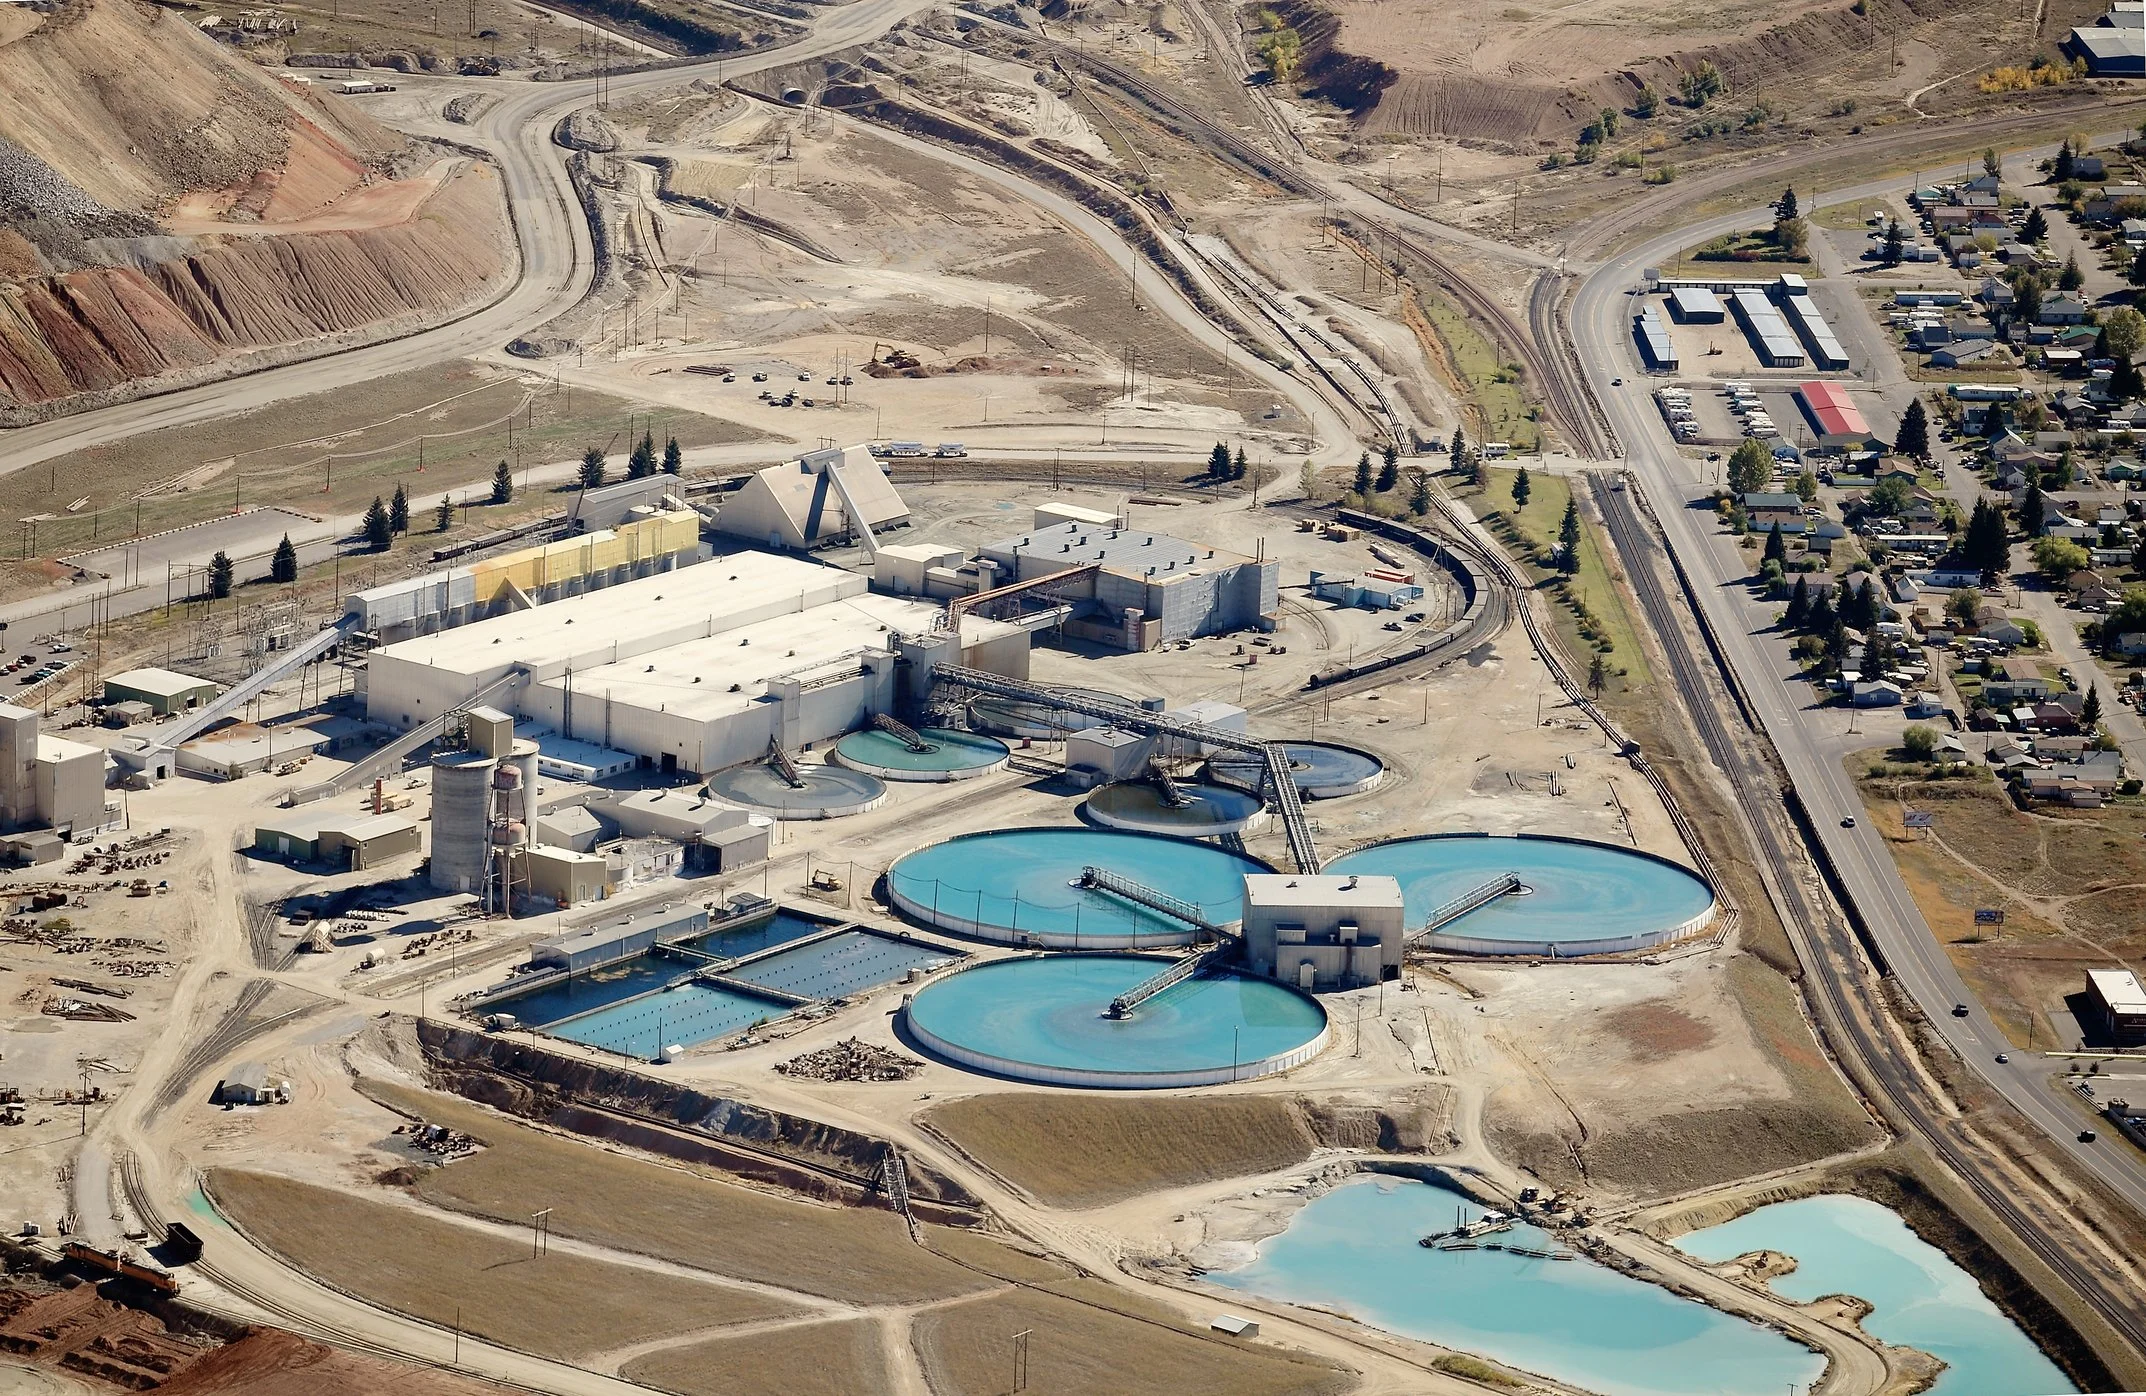
The large data sets - both input and output - show that everything on the planet is in fact moving slowly. This is the starting point for assessing and predicting structural and engineering risk.
Sentinel-1 delivers radar imagery for numerous applications. Radar images are the best way of tracking land subsidence and structural damage.
InSAR starts the process of discovery.
Find slow patterns of movement in the ground and in built objects, everywhere, with:
Millimeter Accuracy
Time series show how objects have moved since the previous measurement. Compare measurements on millimeter-scale.

Constant updates
Your data can be calculated as often as satellites acquire an image, semi-daily, or as often as you need for your business.

High Density
Our maps contain up to 100,000 measurements per km2 over large areas. A quantum leap in effectiveness compared to conventional levelling campaigns.

Decades of data
Over many areas you can access data going back to 1992 to assess long term motion of individual objects and the areas around it.

Global Reach
We monitor all types of assets, whatever their size and wherever they are in the world.
Dealing with 100’s of control parameters in InSAR data processing
“SkyGeo’s role is to help our customers with the best InSAR possible, related to their assets, and to provide them with actionable intelligence.
In our 15 years of applying InSAR, we have learned that the technology of parameter estimation using InSAR is extremely tuneable with 100’s of control parameters.
This tuning results literally in an unlimited number of different potential answers.
At SkyGeo, we listen to our users first - and then work backwards from the problems they face to find the optimal InSAR configuration and the clearest actionable solution.”
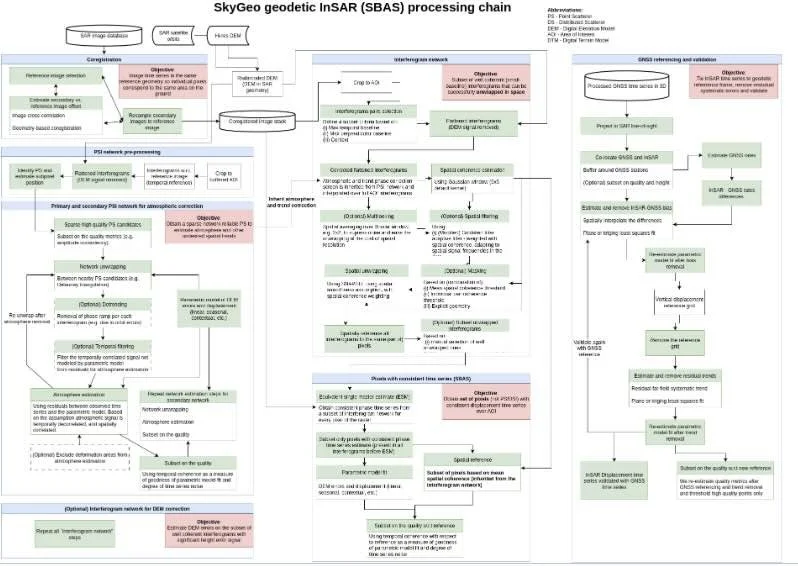
SkyGeo’s approach to InSAR data processing
One example of this ‘tunability’ of SkyGeo’s InSAR data processing capability is the ‘point-density/point-quality’ trade-off.
The quality of our estimates is only partly dependent on our methods and algorithms. The two other factors are the underlying SAR scenes and the engineer doing the processing, making the decision about the control parameters.
For example, where we assess coherent scatterers, we are not able to provide reliable displacement estimates over a water surface using InSAR, which is a consequence of the physical characteristics of water surfaces in relation to radar waves.
When rendering the data in the viewer, there is a trade-off between the quality and density of points. If more points are needed, this will typically come at the expense of their quality, and more noise will leak in. Vice versa where higher quality points are needed for higher confidence assessment of motion, this will come at the expense of point density.
There is no generic ‘right’ or ‘wrong’ in this trade-off. The InSAR practitioner has to find the optimal trade-off for each particular use case.
This configuration decision happens whether you as a user know it or not. At SkyGeo we prefer to make this trade-off transparent (as we do with all of the InSAR configuration). We base on the interactions of our InSAR domain experts with the user. And rather than with a black-box product, the user winds up with fit-for-purpose data for every use case - in this case with the best point density / point quality combination..
Frequently Asked Questions
-
InSAR (Interferometric Synthetic Aperture Radar) uses repeat radar satellite images to estimate how the Earth’s surface and built objects move over time. It turns complex radar measurements into time-series displacement estimates that can reveal slow-motion deformation patterns.
-
InSAR can detect very small movements, but accuracy depends on surface conditions, satellite geometry, processing choices, and signal coherence. Understanding uncertainty and quality is as important as the headline displacement number.
-
Yes. Apparent movement can be normal, or a processing artefact, while subtle accelerating trends can signal developing instability. Correct interpretation requires baselines, context, and expertise—especially where decisions affect safety or operations.
-
There is no universal threshold. Triggers depend on rate of change, spatial extent, historical behaviour, asset tolerance, and consequences of failure. InSAR is most effective when used within a clear decision framework supported by expert review.
Contact Us
Have a question about InSAR technology - the fundamentals or its application? Let us know.